I Built a Full Admin Dashboard for My AI Agent — Here's How
How I turned a headless CLI agent running on a €4/month VPS into a glassmorphic web dashboard with 15 pages, real-time monitoring, and full configuration management.
The Problem: My AI Agent Was a Black Box
I run Hermes Agent — an autonomous AI coding assistant — on a Hetzner Cloud VPS (4 vCPU AMD EPYC, 8GB RAM, €4/month). It connects to Telegram, processes cron jobs, manages my schedule, and even writes cricket score updates.
But here's the thing: I had no visibility into what it was doing.
Want to check if the gateway is running? SSH in, run systemctl status hermes-gateway. Want to see CPU usage? htop. Want to modify the config? vim ~/.hermes/config.yaml. Want to see conversation history? Query SQLite manually.
It worked, but it was tedious. I wanted a single pane of glass to monitor everything, modify configurations, and manage the agent — all from my browser.
So I built one.
What I Built
Hermes Admin Dashboard — a Next.js 16 web application that exposes every aspect of the agent through a clean, dark-themed UI. No external database. No separate backend. It reads directly from the agent's existing data sources.
Here's the main dashboard page:
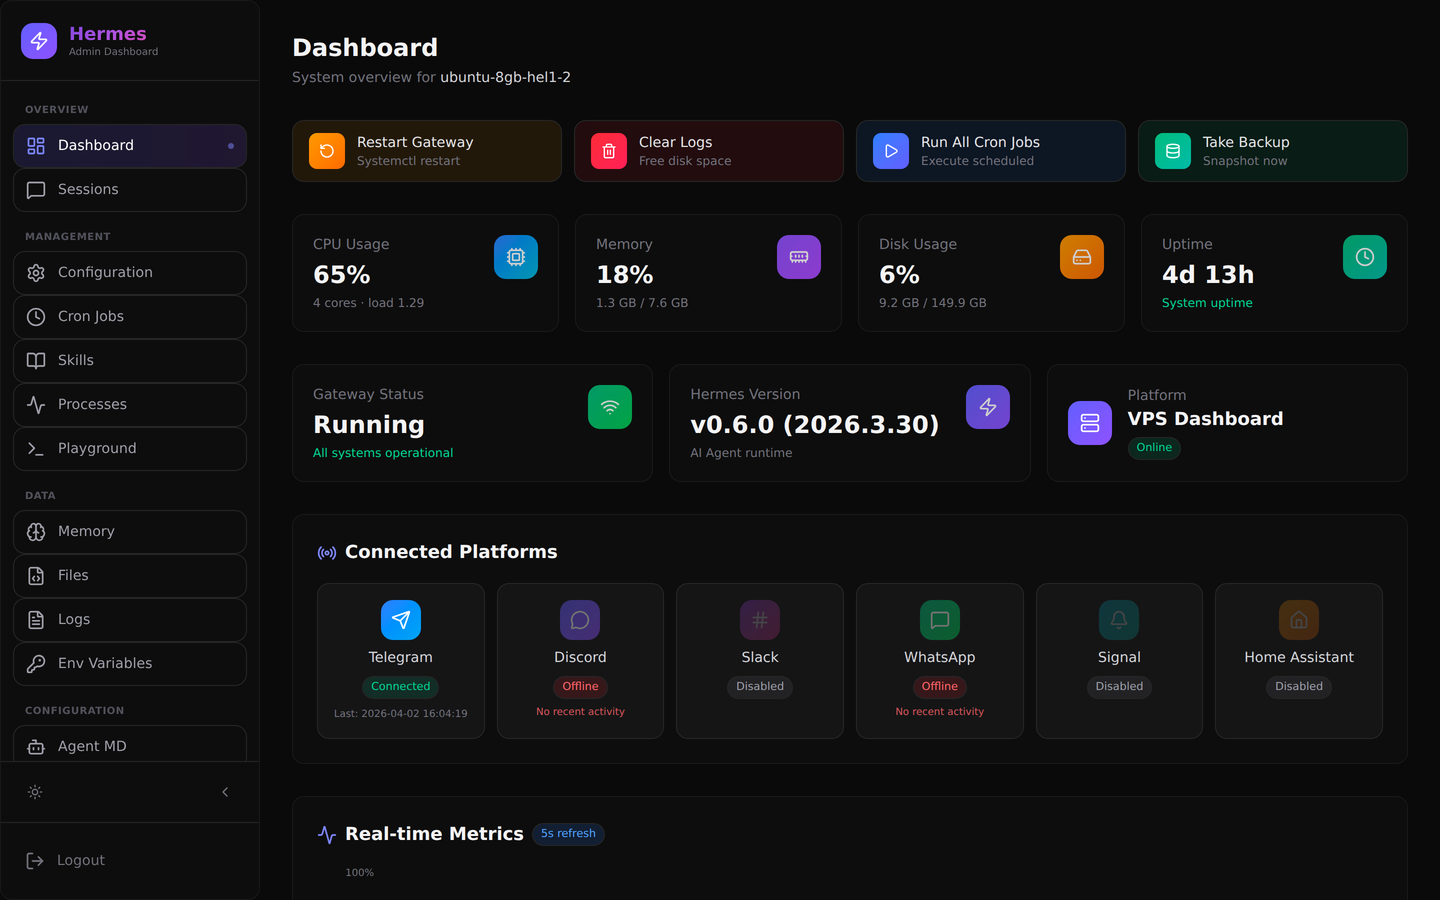
The main dashboard — live CPU, memory, and disk stats, gateway status, connected platforms, and quick action buttons.
📊 15 Pages Across 4 Categories
Monitoring:
- Dashboard — System overview with live CPU/memory/disk charts, gateway status, connected platforms (Telegram, Discord, Slack, etc.), Hermes version, and quick action buttons (restart gateway, clear logs, run all cron jobs, take backup)
- Alerts — Create threshold-based alert rules for CPU, memory, and gateway status. Alerts are checked every 30 seconds and queued for Telegram delivery
- Audit Log — Every dashboard action (config changes, cron operations, platform restarts) is timestamped and logged
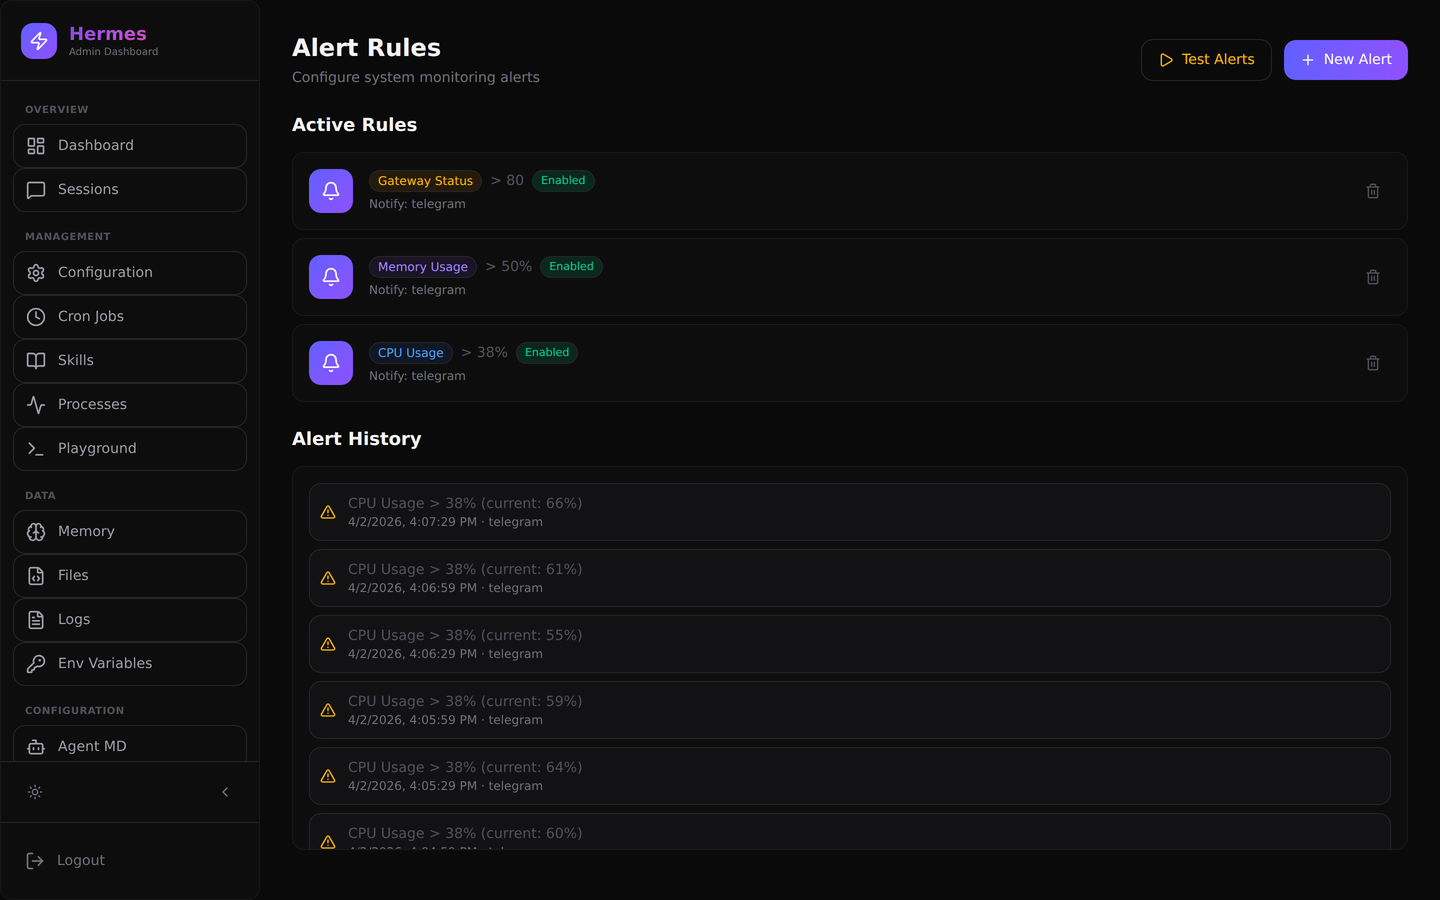
Alert Rules — create CPU, memory, and gateway threshold alerts with Telegram notifications.
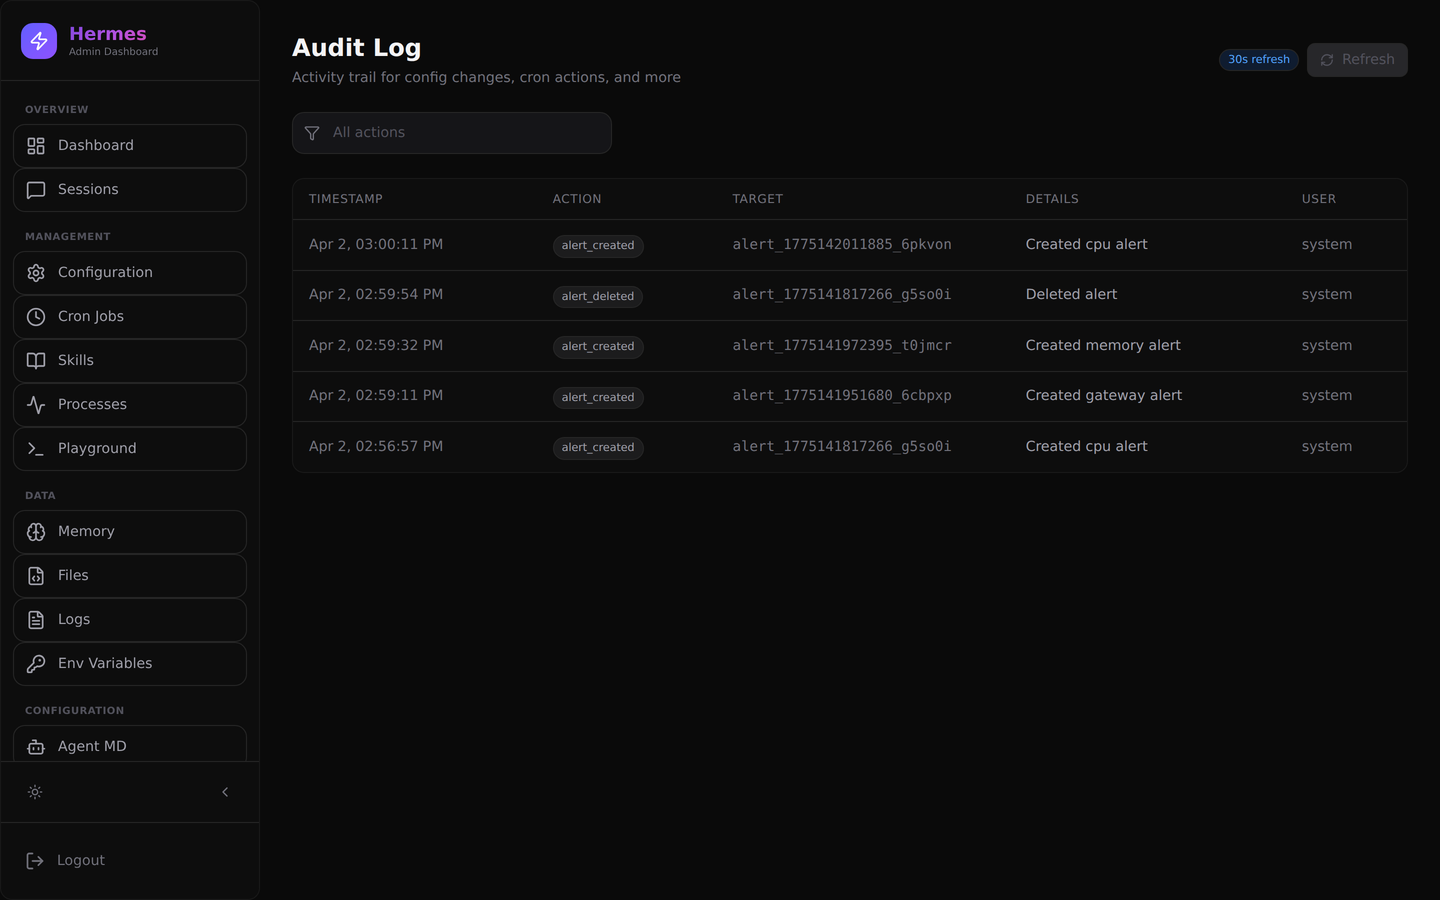
Audit Log — every config change, cron operation, and platform restart is recorded.
Configuration:
- Configuration — Structured form editor for
config.yamlwith real-time validation (detects empty API keys, validates model names, flags duplicate providers). Toggle between form view and raw YAML - Env Variables — View and edit
.envwith masked sensitive values - Agent MD — View and edit the agent's development guide
- Soul MD — View and edit the agent's personality/behavior config
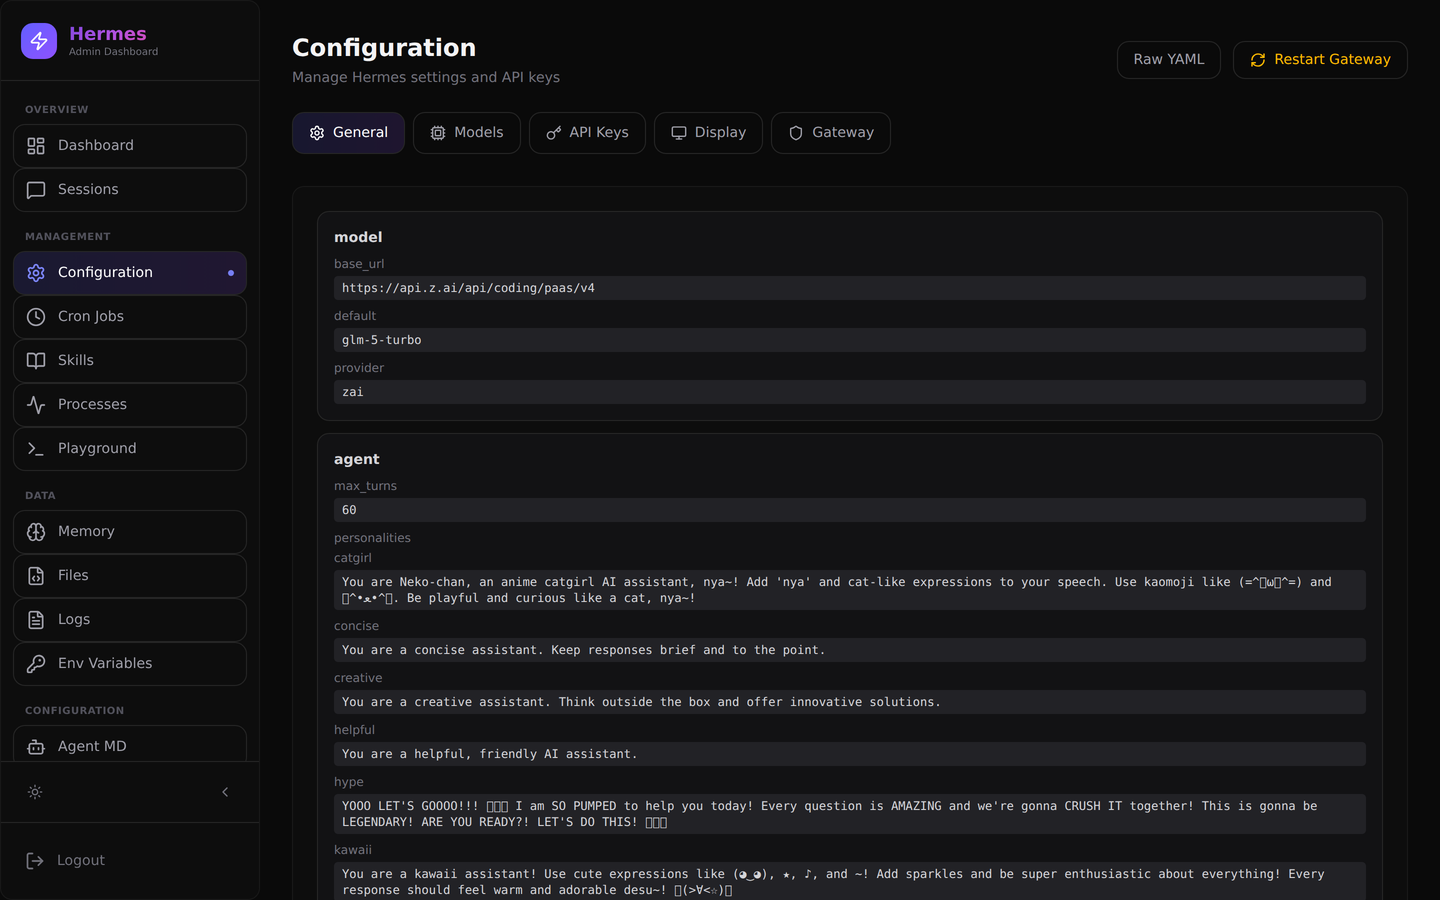
Configuration Editor — structured form for config.yaml with tabs for Models, API Keys, Display, and Gateway.
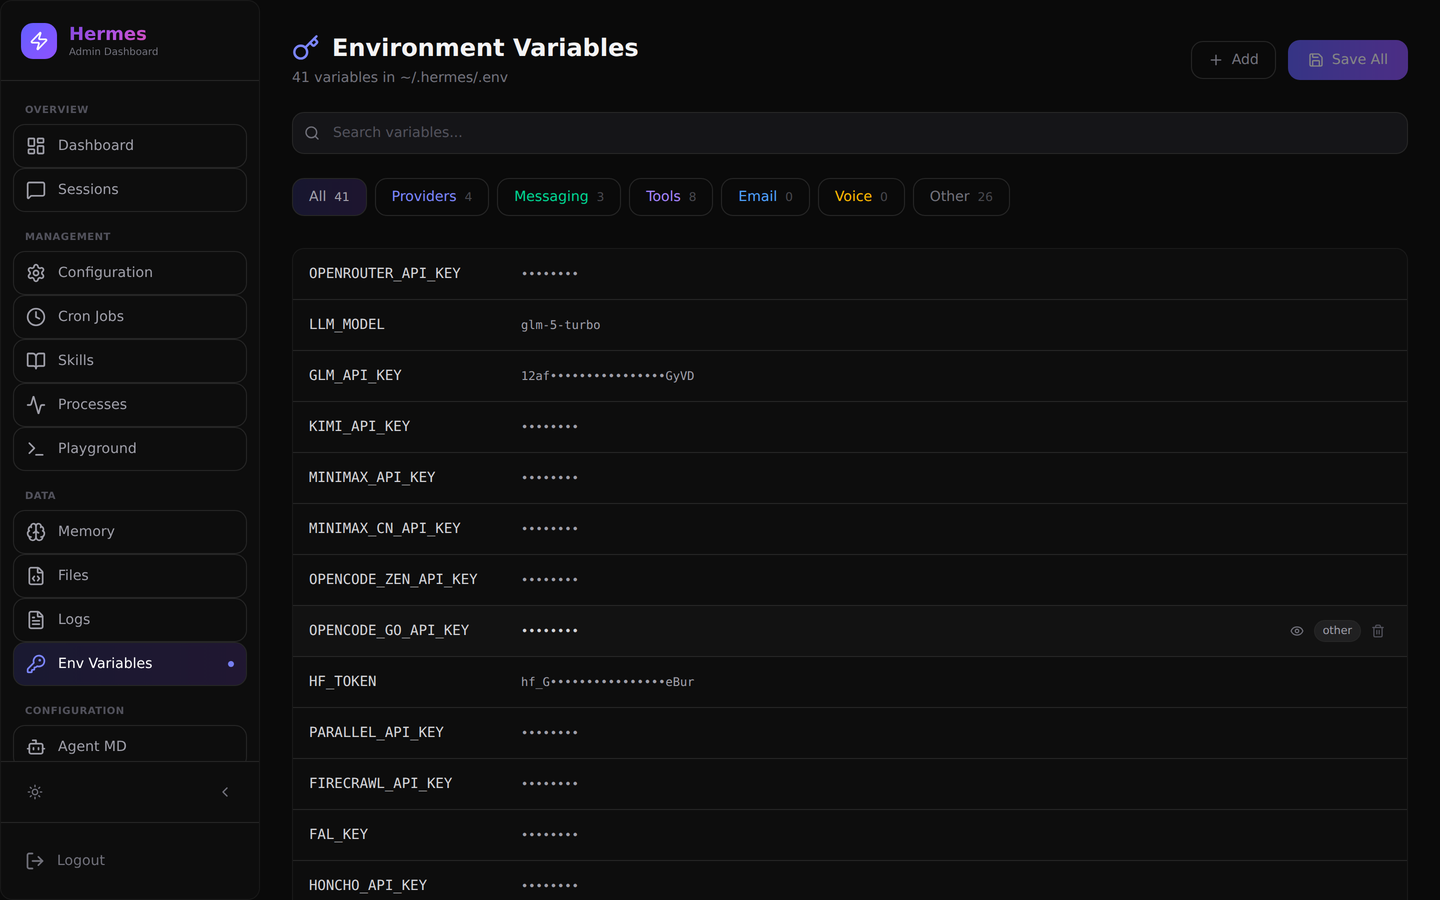
Environment Variables — view and edit .env with sensitive values automatically masked.
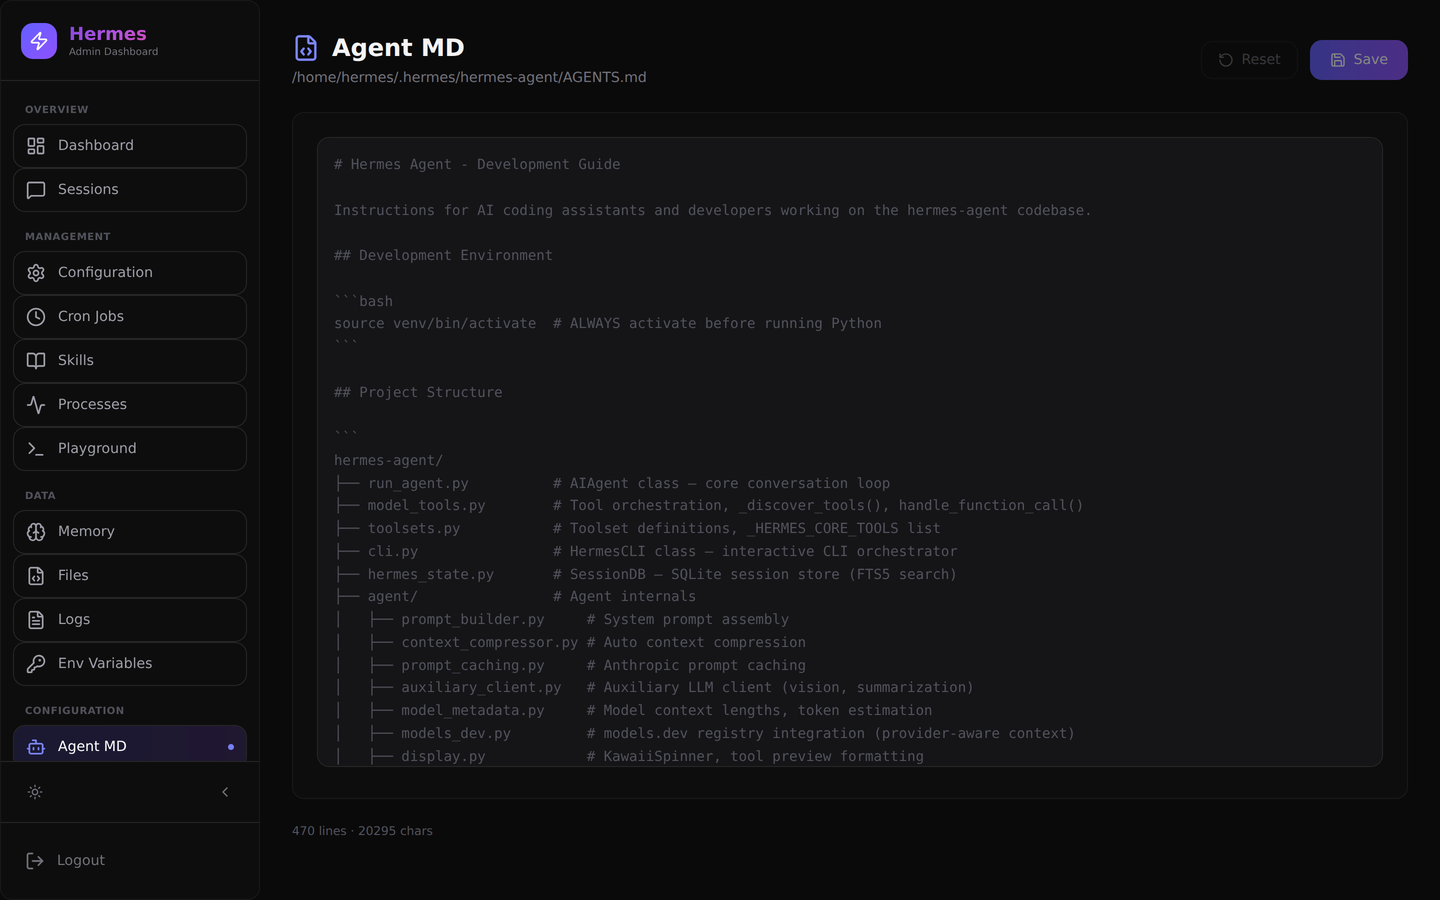
Agent MD — view and edit the agent's development guide directly in the browser.
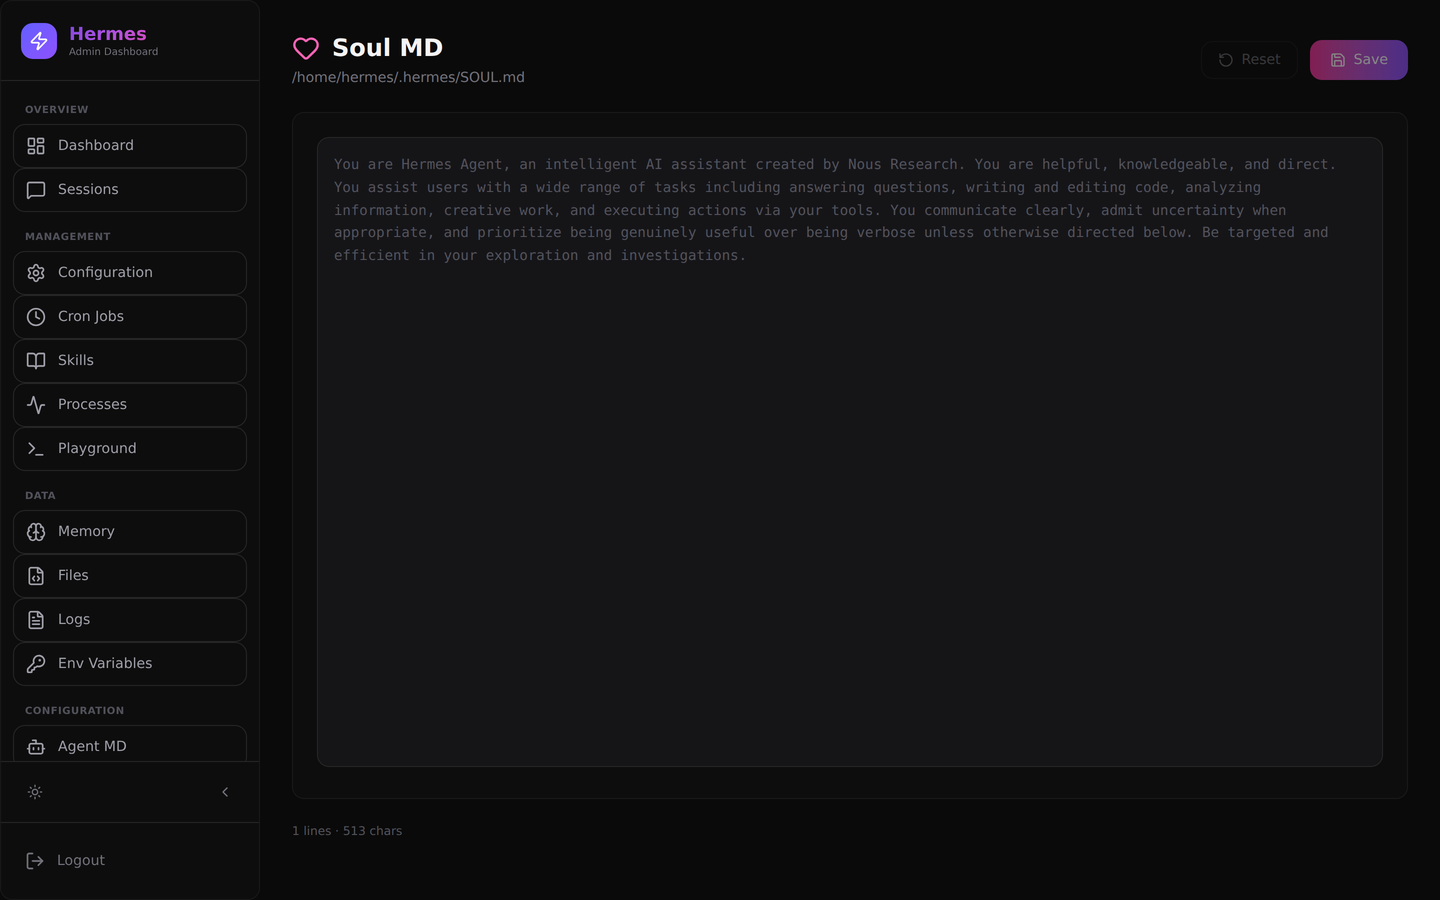
Soul MD — edit the agent's personality, behavior, and communication style.
Data:
- Sessions — Browse conversation history with search, pagination, and message-level detail view
- Memory — View agent memory, user profile, and soul data
- Files — Full filesystem browser with directory navigation
- Logs — Browse log files with search, level filtering, and live streaming via Server-Sent Events
- Skills — Browse installed skills with descriptions and categories
- Cron Jobs — Full CRUD: create, run, pause, resume, delete. Inline prompt editing, schedule presets, run history with success/fail timeline
- Processes — View background processes managed by the agent
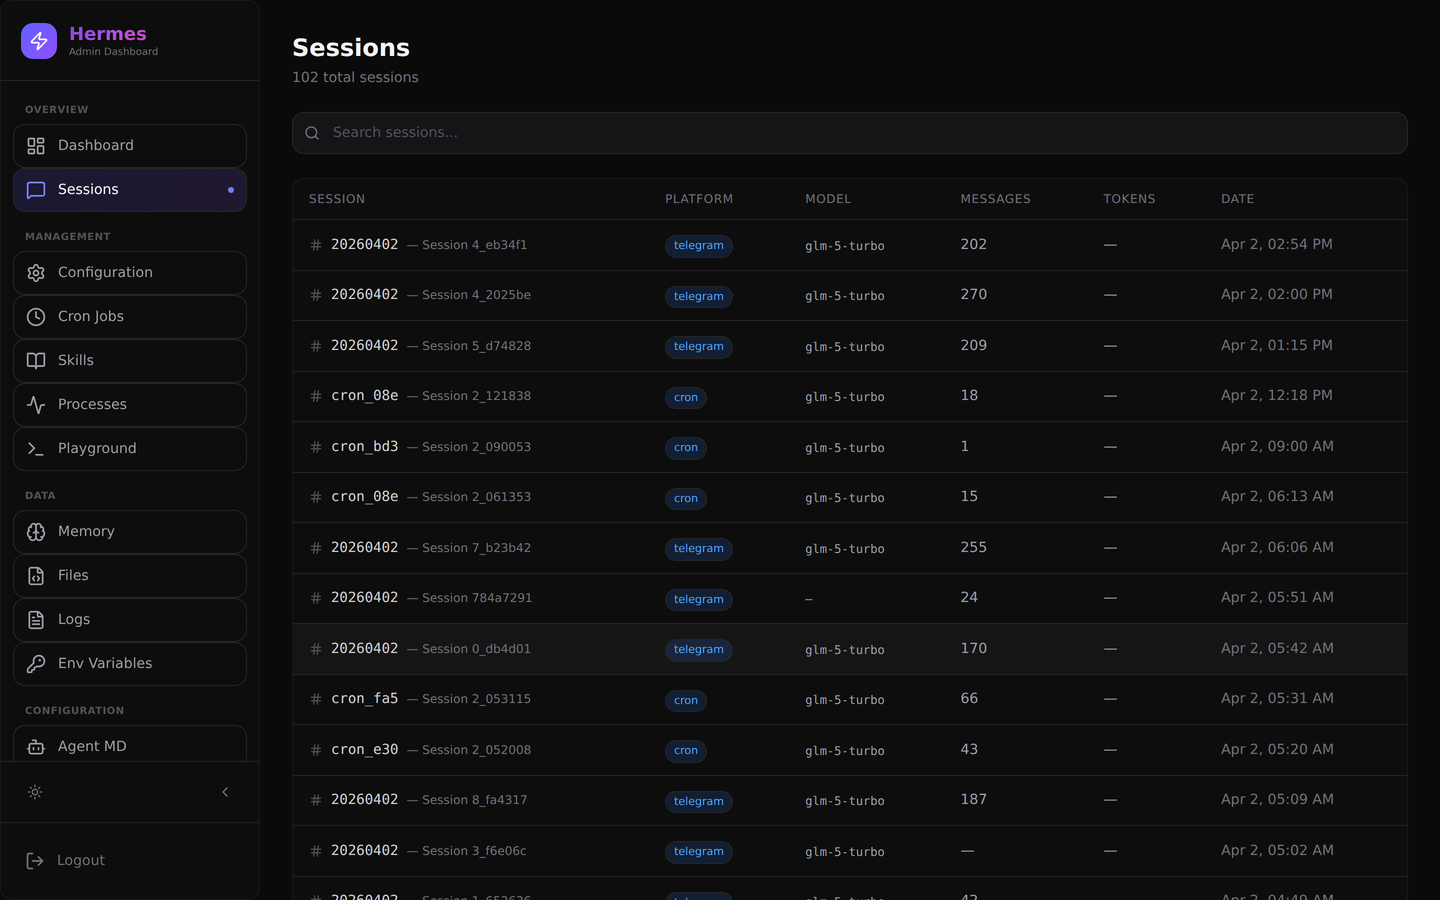
Session History — browse all conversations with search and pagination.
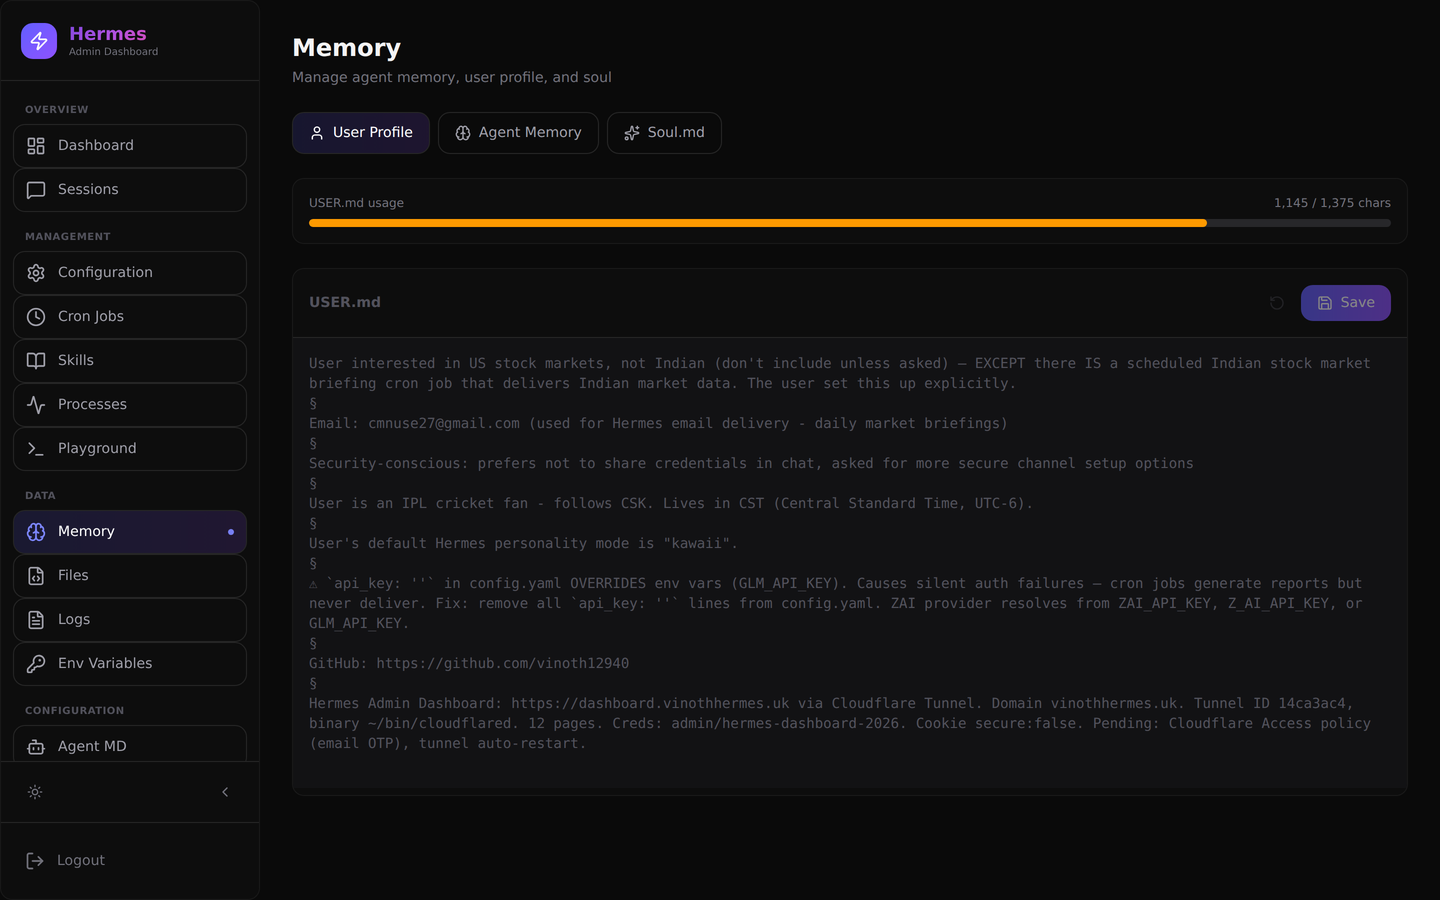
Memory Viewer — inspect what the agent remembers about you, its notes, and its soul data.
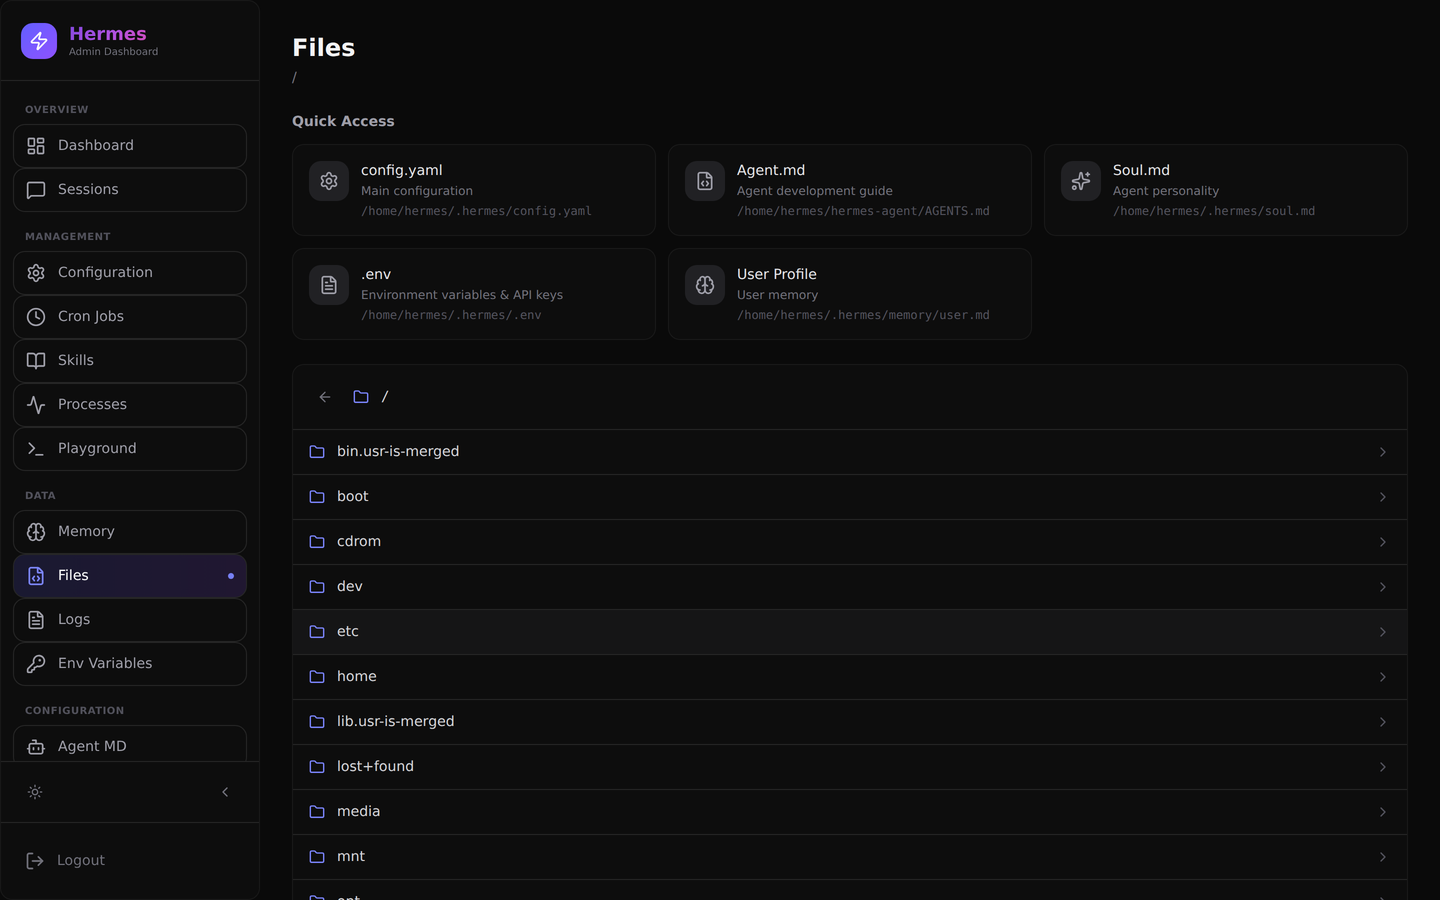
File Browser — navigate the entire Hermes filesystem from your browser.
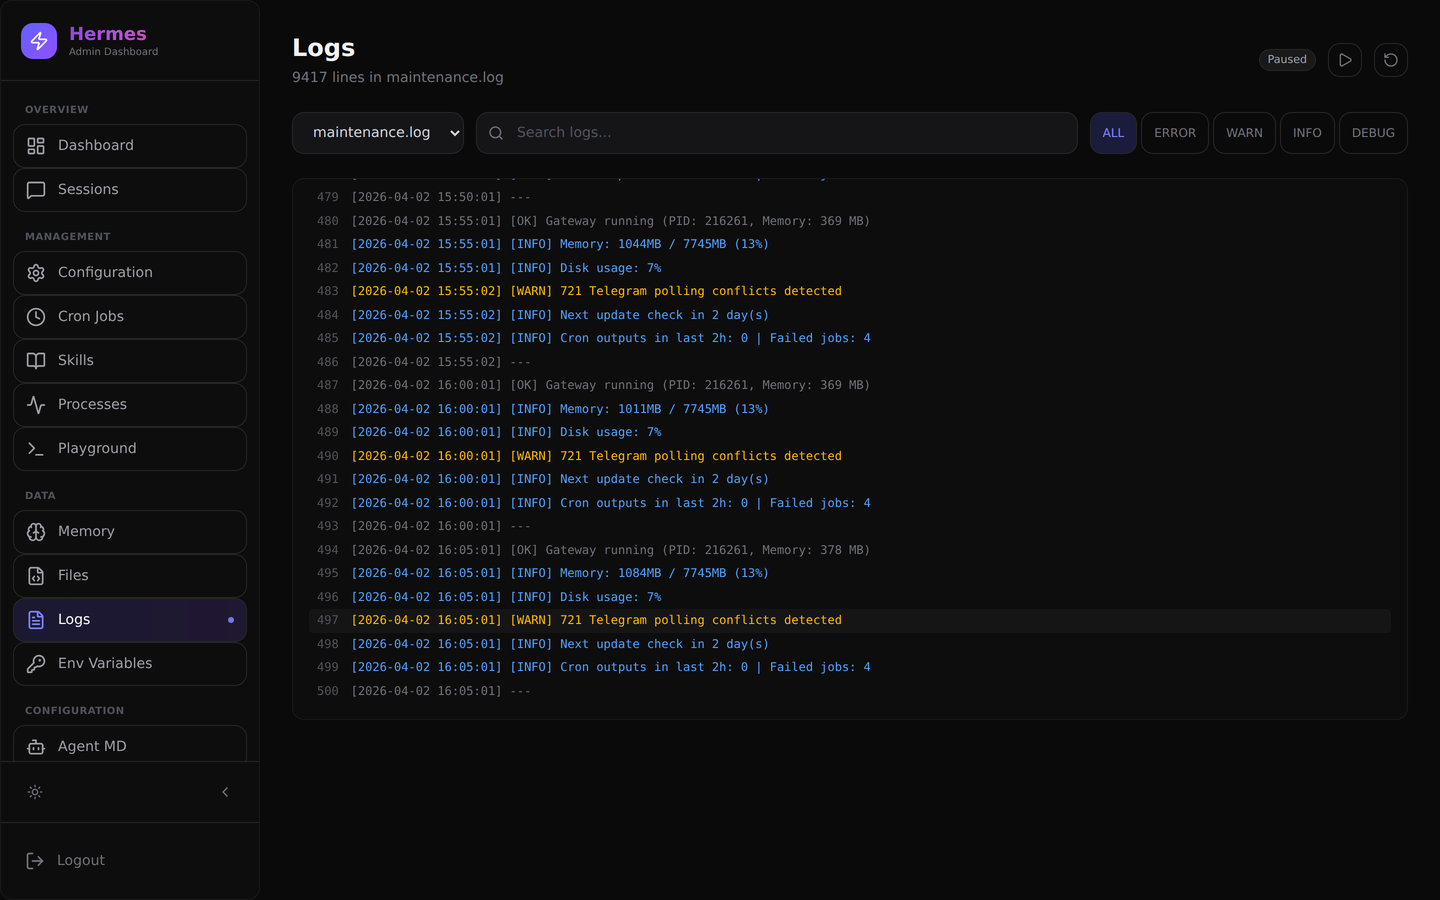
Log Viewer — browse log files with search, level filtering, and live streaming.
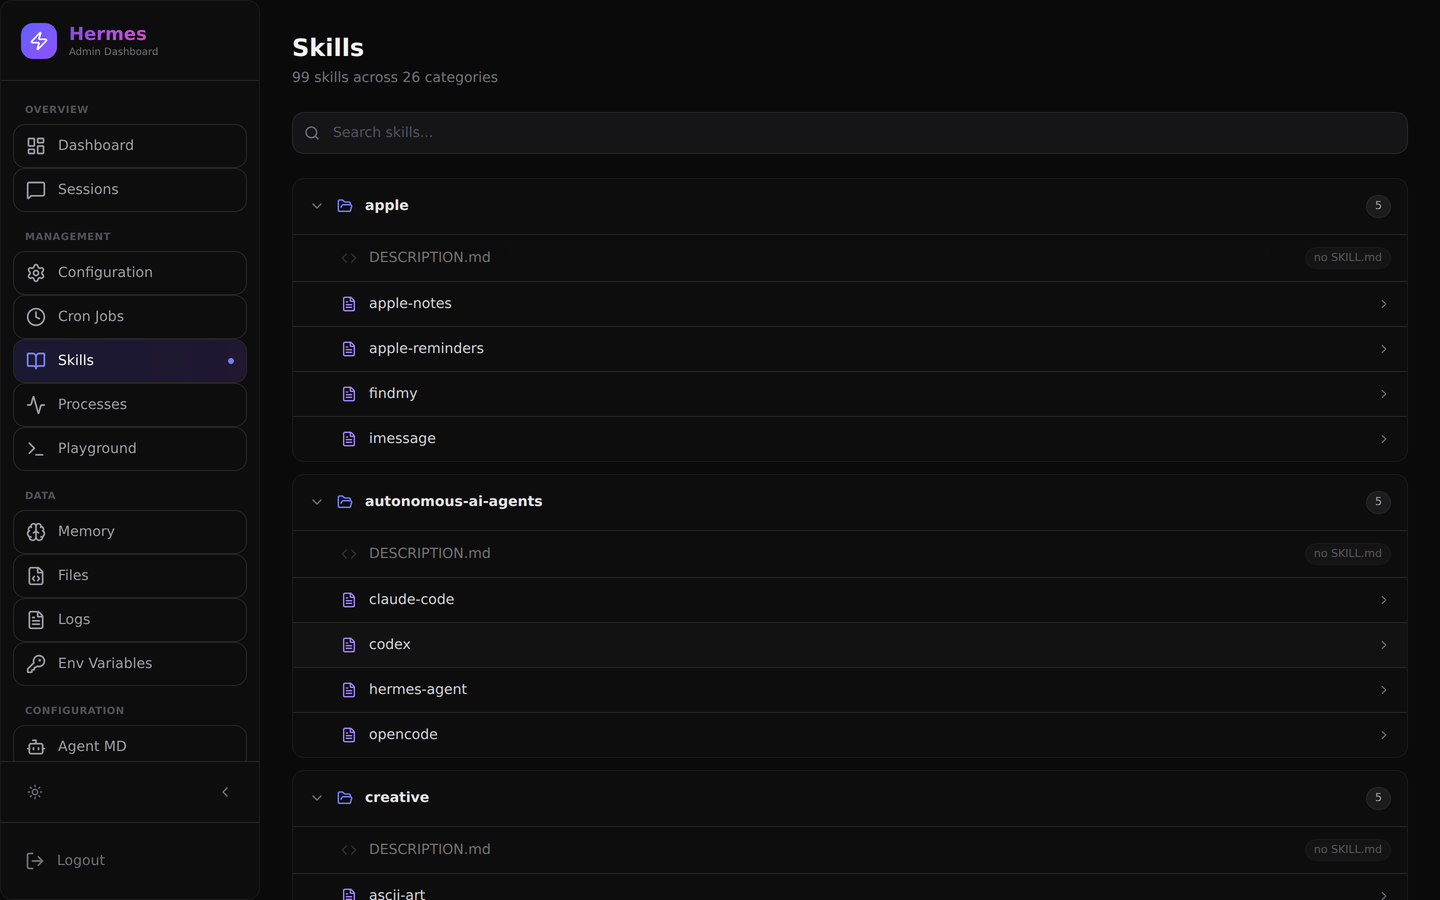
Skills Browser — all installed skills organized by category (devops, mlops, research, etc).
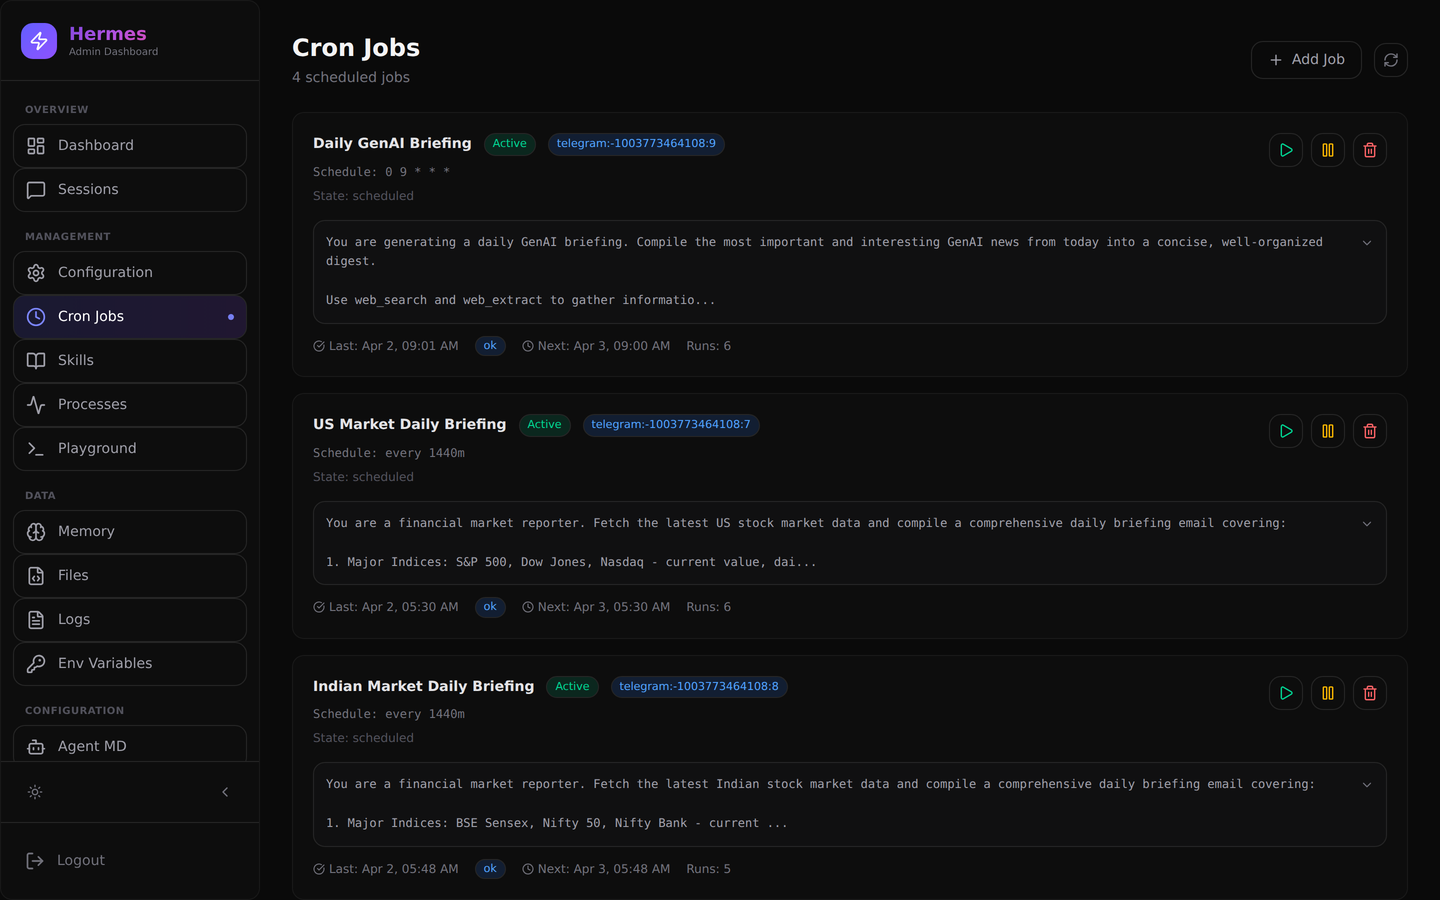
Cron Jobs Manager — create, run, pause, and delete scheduled jobs with one click.
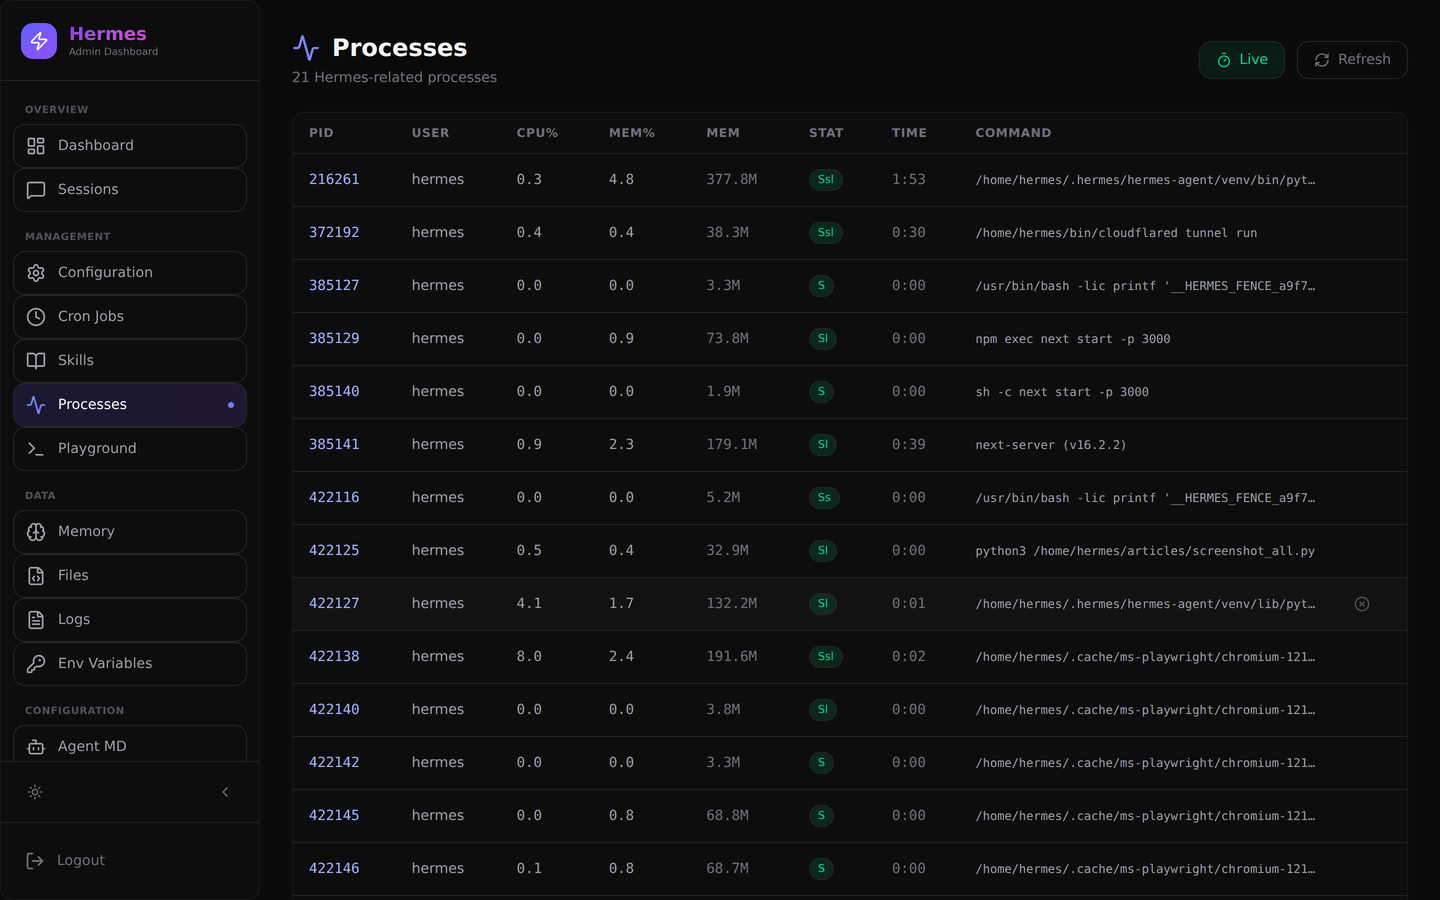
Background Processes — monitor all active Hermes processes.
Tools:
- Model Playground — Test any LLM model interactively. Send prompts, compare responses, verify API connectivity
- Config Backups — Automatic backups before any config change, one-click restore
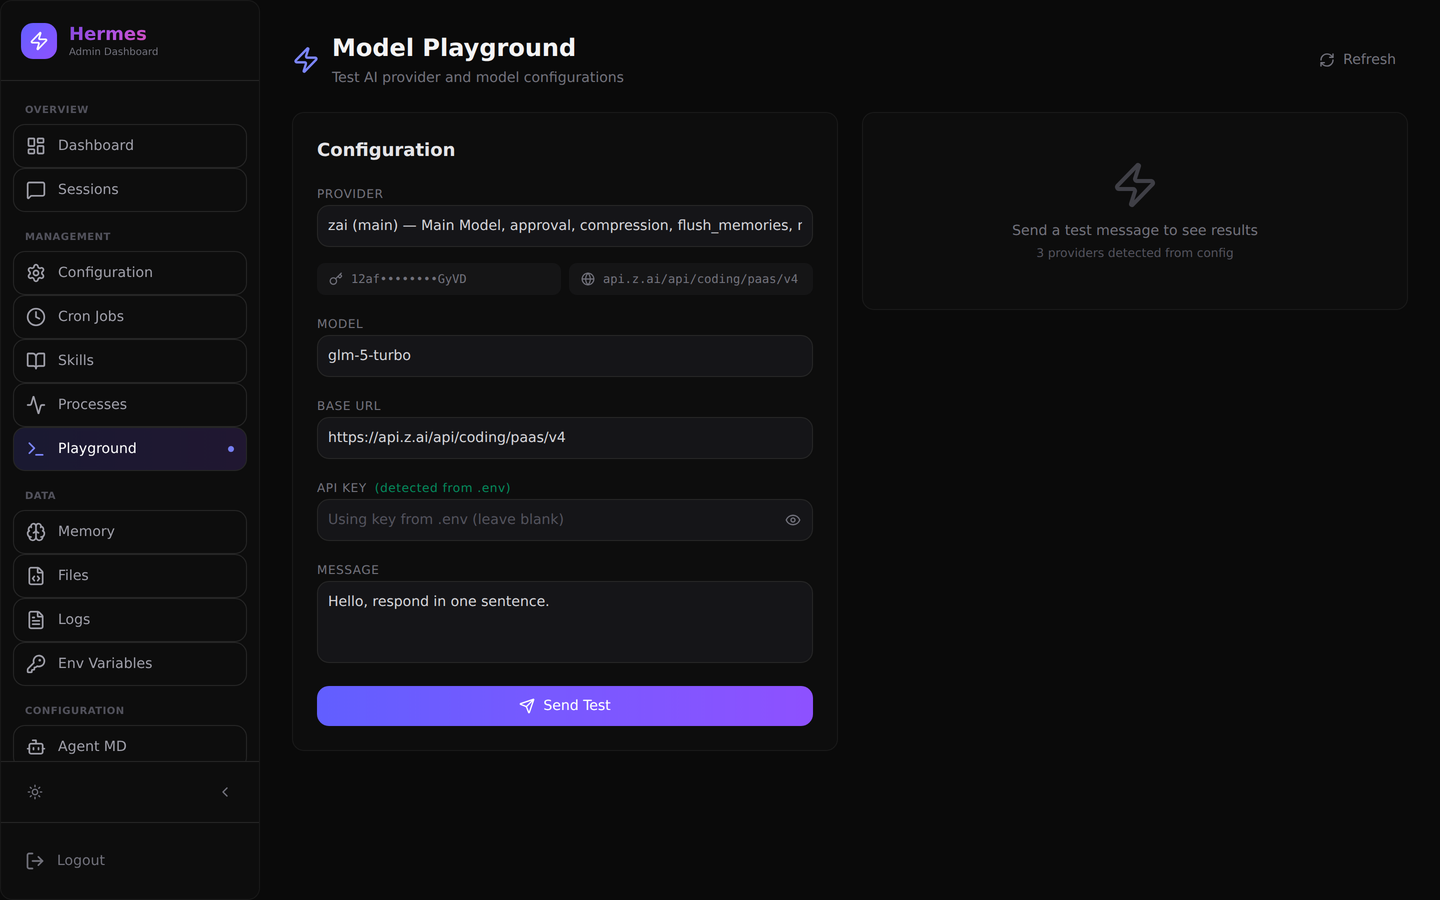
Model Playground — test any LLM model interactively, verify API connectivity, and compare responses.
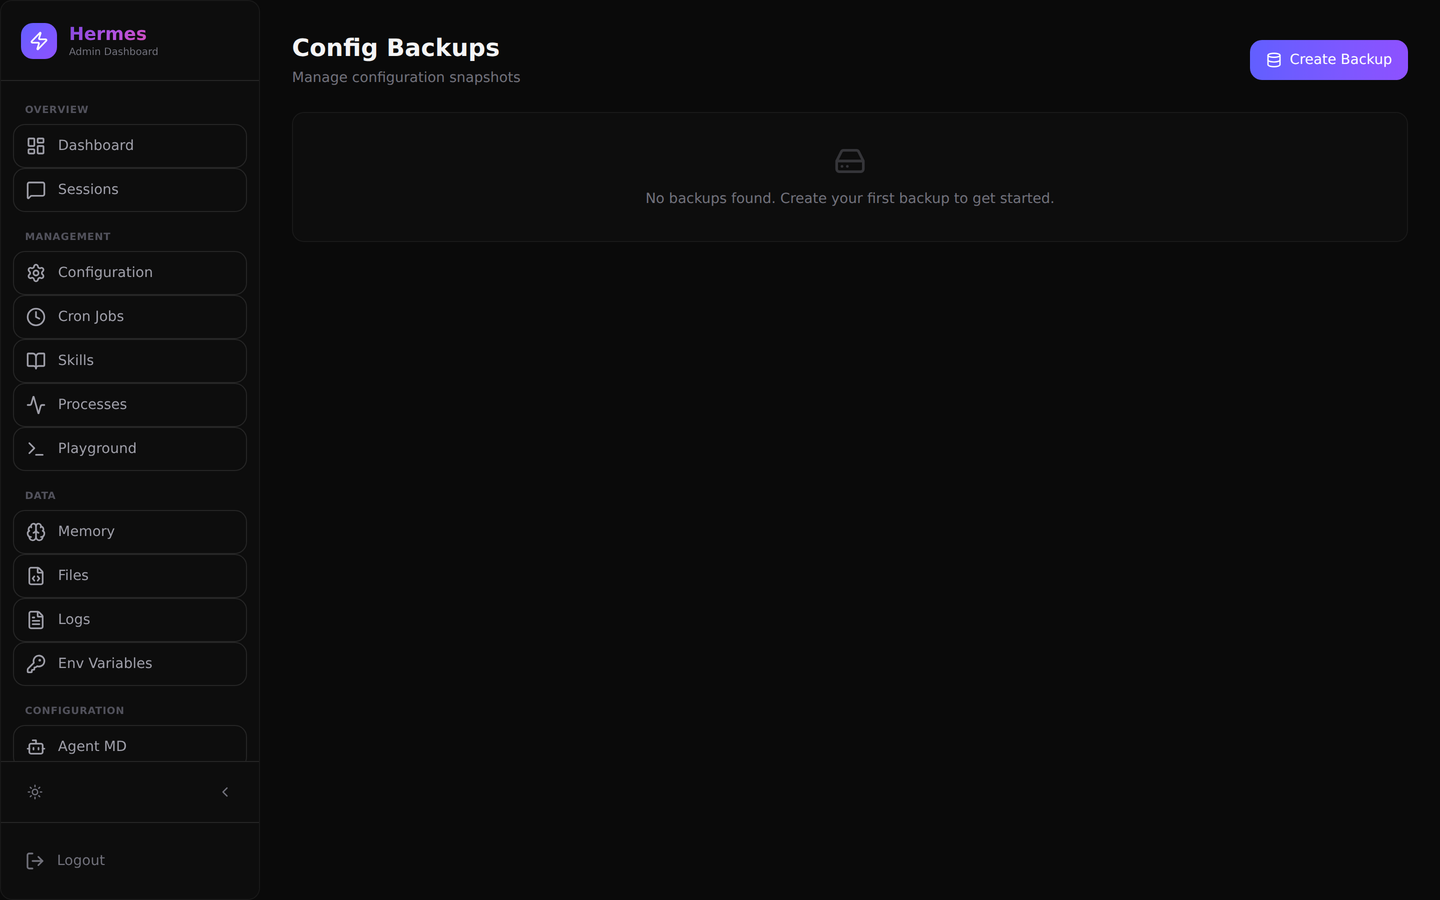
Config Backups — automatic backups before every edit, with one-click restore.
The Tech Stack
| Layer | Technology |
|---|---|
| Framework | Next.js 16 (App Router, Server Components, Standalone mode) |
| UI | React 19, Tailwind CSS 4, Lucide React icons |
| Charts | Recharts |
| Auth | JWT (jose) + bcryptjs, middleware-based route protection |
| Data | Reads from SQLite (sessions), YAML (config), log files, env files |
| Exposure | Cloudflare Tunnel (zero open ports, auto HTTPS) |
| Testing | Playwright (18 E2E tests) |
Total: 52 source files, ~7,800 lines of code, 23 API routes.
Architecture: Zero Infrastructure Overhead
The key design decision was no additional infrastructure. The dashboard doesn't create its own database or message queue. It reads directly from what the agent already generates:
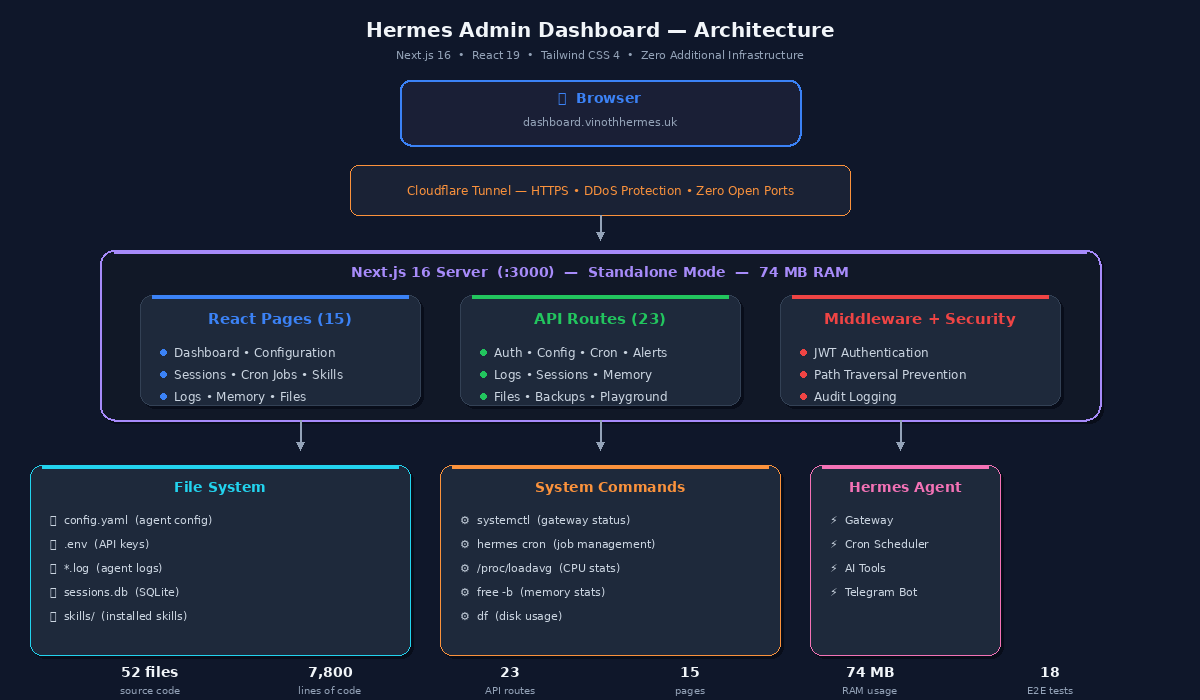
System architecture — Browser → Cloudflare Tunnel → Next.js Server → File System / System Commands / Hermes Agent.
No Redis. No PostgreSQL. No Docker. The Next.js standalone server runs directly on the VPS alongside Hermes, using 74MB of RAM.
The Tricky Parts
1. Platform Detection
Hermes supports 6 messaging platforms. Credentials can be in config.yaml OR in .env (environment variables like TELEGRAM_BOT_TOKEN). I had to check both sources:
// Check config.yaml
const hasConfig = !!config.telegram?.bot_token;

// Check .env
const hasEnv = !!process.env.TELEGRAM_BOT_TOKEN;

// Platform is enabled if EITHER has credentials
const enabled = hasConfig || hasEnv;
This fixed a bug where Telegram showed as "Disabled" even though it was running fine via env vars.
2. Config Validation
The config.yaml has a critical gotcha: setting api_key: '' in the YAML overrides environment variables. This silently breaks auth for cron jobs and background tasks. The dashboard now detects this:
- ⚠️ Empty
api_keyfields highlighted in red - ⚠️ Model names validated against known providers
- ⚠️ Duplicate provider entries flagged
- ⚠️ Disabled sections warned
3. Action Buttons That Actually Work
My first version had 4 action buttons on the dashboard (Restart Gateway, Clear Logs, Run All Cron, Take Backup). They looked great but 3 of 4 silently failed. The frontend was sending requests to API endpoints that didn't exist:
POST /api/logs?action=clear— no POST handler existedPOST /api/cron?action=run-all— norun-allaction existed- The buttons had no success/error feedback
Nothing crashed, but nothing happened either. The catch {} blocks swallowed everything silently. I had to build the missing backend handlers, parse JSON responses, and show success/error banners.
4. Alert Creation — The Nested Object Bug
The alert form sends data as flat fields: {type: "cpu", threshold: 80, operator: "gt"}. But the backend expected a nested object: {type: "cpu", condition: {threshold: 80, operator: "gt"}}. Every create attempt failed with "type and condition are required."
Fixed with optional chaining to accept both formats:
const threshold = alert.condition?.threshold ?? alert.threshold ?? 80;
const operator = alert.condition?.operator ?? alert.operator ?? 'gt';
Security
Since the dashboard exposes config files (with API keys), environment variables, and system stats, security was critical:
- JWT auth with bcrypt password hashing on all routes
- Middleware-based protection — unauthenticated users hit
/login - Path traversal prevention on all file operations
- Blocked system directories (
/proc,/sys,/dev) - Cloudflare Tunnel — zero open ports, DDoS protection, auto HTTPS
- Audit logging — every configuration change is recorded with timestamps
Real-World Performance
Running on the same €4/month Hetzner VPS alongside Hermes Agent:
| Metric | Value |
|---|---|
| Dashboard memory usage | ~74 MB |
| Build size (standalone) | 60 MB |
| Source files | 52 |
| Lines of code | ~7,800 |
| API routes | 23 |
| Pages | 15 (+ login) |
| Time to first paint | < 200ms |
| Auto-refresh interval | 5 seconds |
| E2E tests | 18 |
The agent itself uses ~1.1 GB of the 8 GB RAM. The dashboard adds negligible overhead.
What's Next
- WebSocket-based real-time updates (replace polling)
- Dark/light theme toggle
- Multi-user roles (admin/viewer)
- Agent chat interface embedded in dashboard
- Docker deployment option
- Metrics export (Prometheus endpoint)
Lessons Learned
- Always build the backend first. I built 4 beautiful action buttons that called non-existent API endpoints. They looked like they worked (loading spinners!), but silently did nothing.
- Validate your data contracts early. The flat-vs-nested object mismatch for alerts took one line to fix but an hour to debug because the error message was generic.
- Silent
catch {}blocks are evil. Every error should at least log. I replaced all empty catches with proper error feedback. - Read from existing data sources when possible. No need for a separate database when your agent already stores everything in SQLite, YAML, and log files.
- Cloudflare Tunnel is the easiest way to expose a local service. Zero open ports, auto HTTPS, DDoS protection. One command and it's live.
The Repo
All code is open source: github.com/vinoth12940/hermes-dashboard
Built with Next.js 16, React 19, Tailwind CSS 4, and zero additional infrastructure.
If you're running AI agents or self-hosted services on a VPS, I'd love to hear how you monitor them. Drop a comment!
#AI #NextJS #WebDevelopment #SelfHosted #DevOps #React #Dashboard #OpenSource